Find Your SEO Keyword Niche
using Text Network Visualization
generate the keywords that people search for but cannot yet find
Start Using Keyword Graph
Create an account or ask us about the enterprise solution. We offer a 7-day money-back guarantee.
How Keyword Graph Works
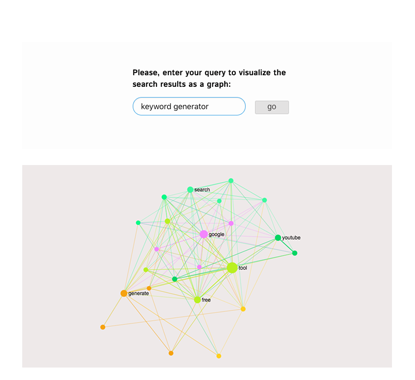
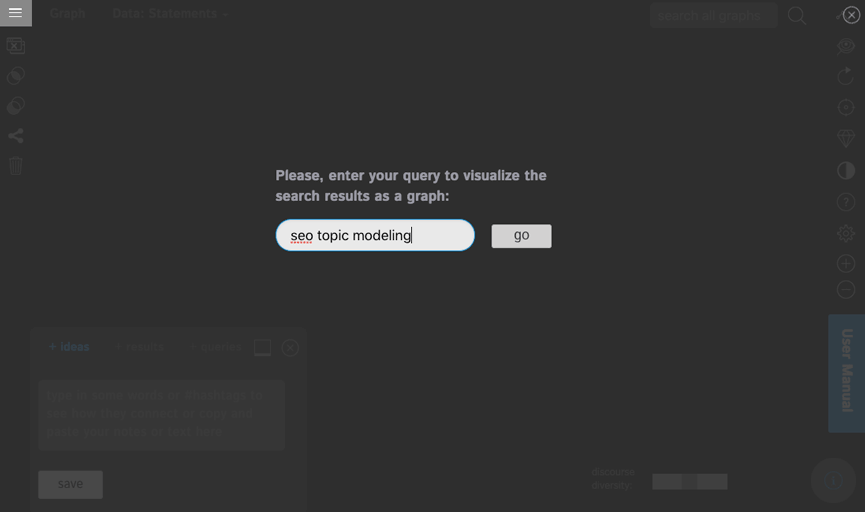
1. Start with a Search Query
Enter a search query and we will import the top search results and the keywords that people tend to use with your search query.
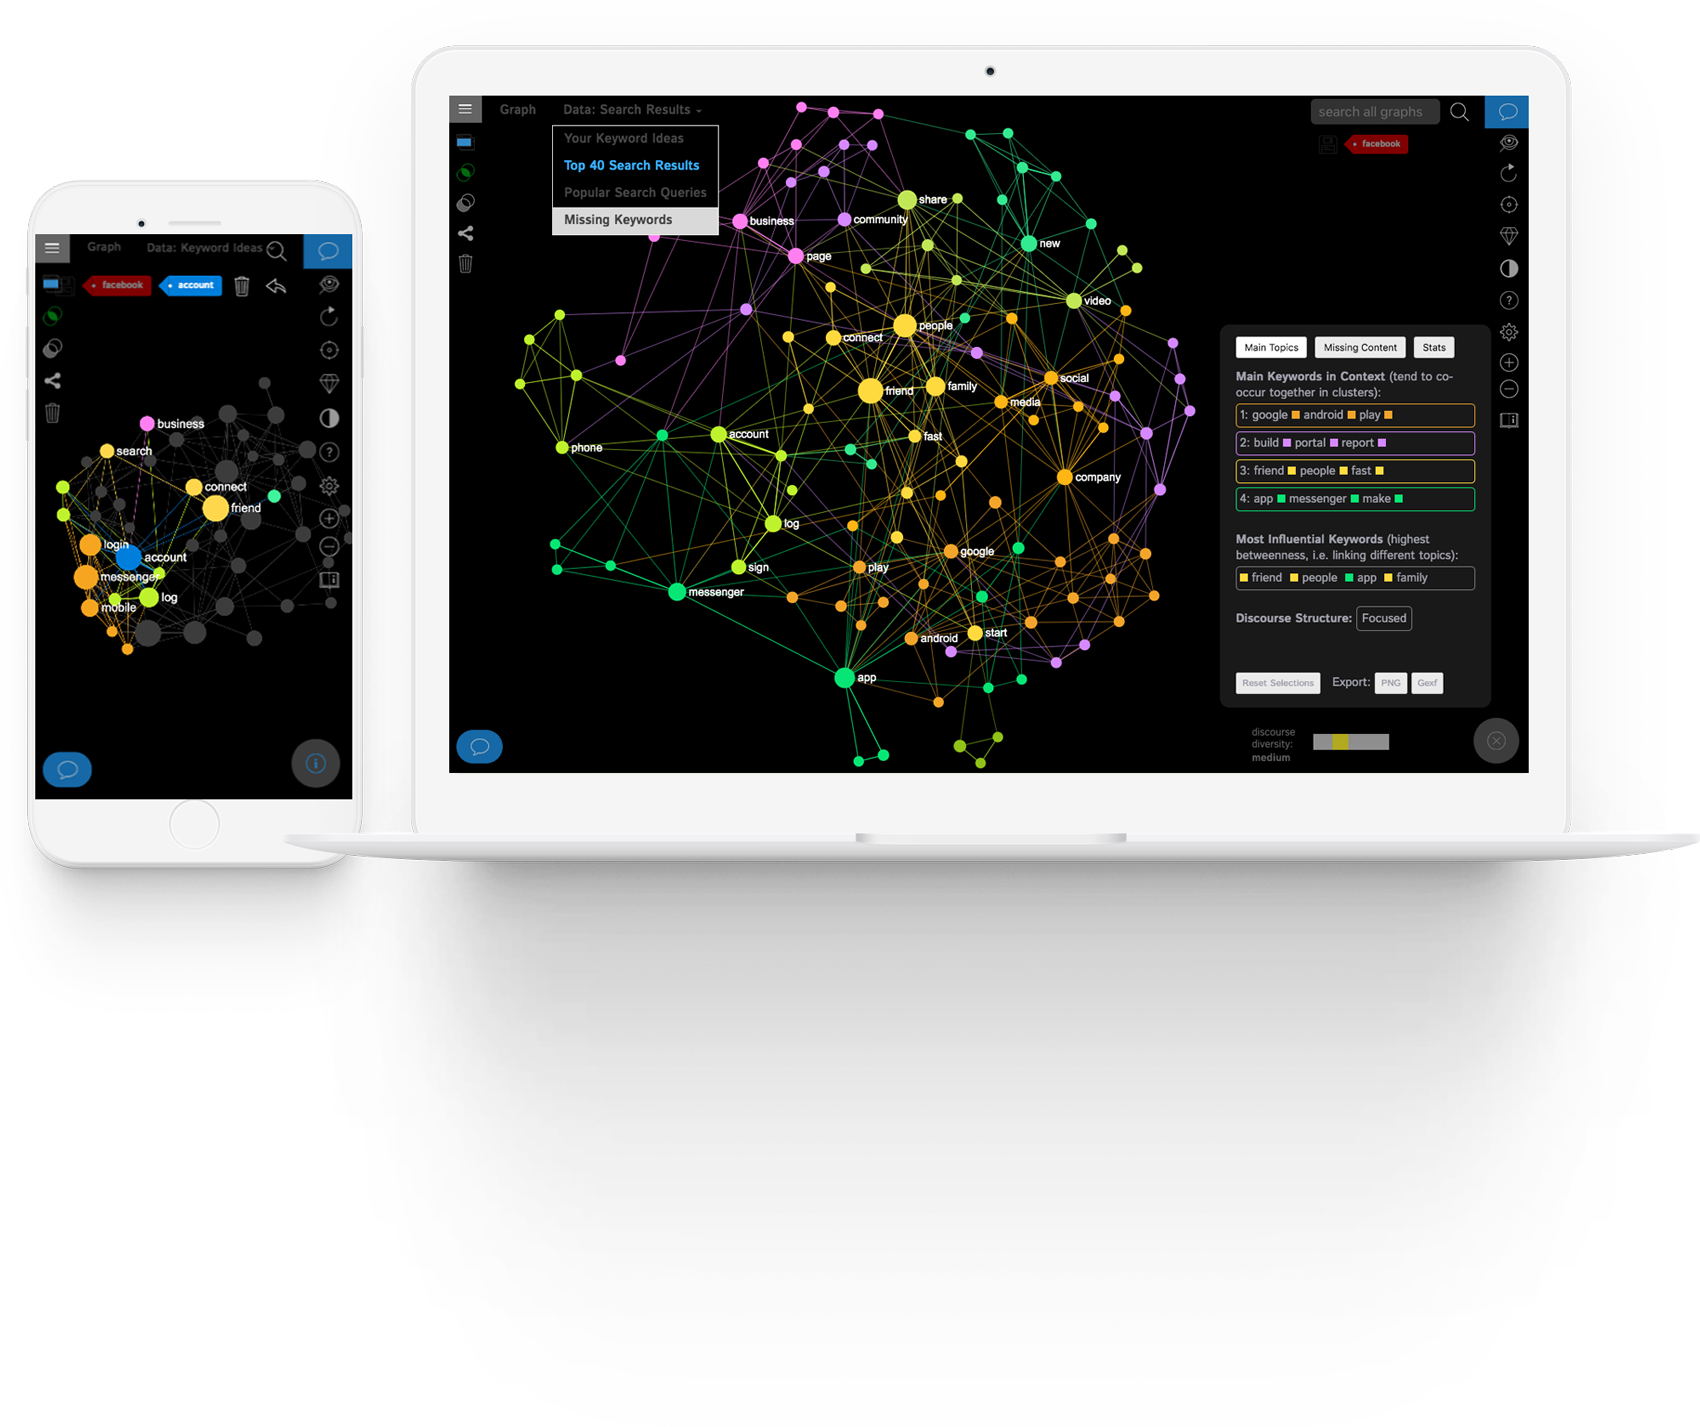
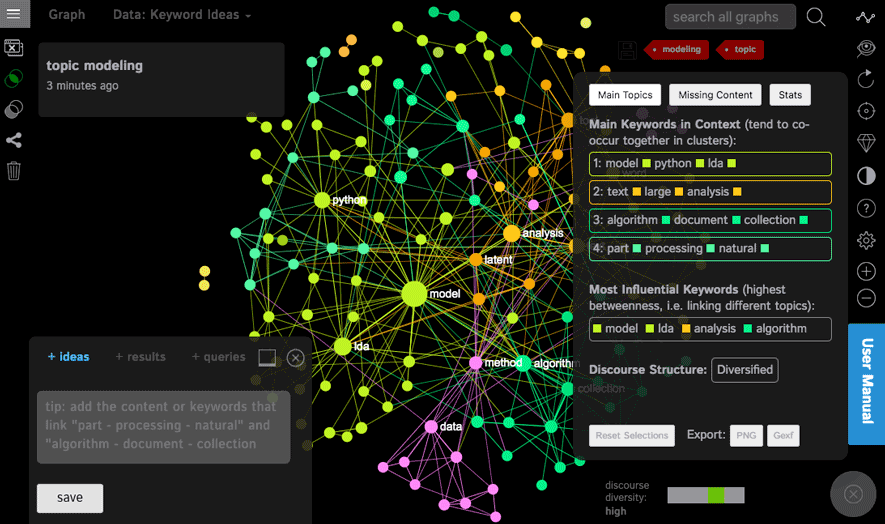
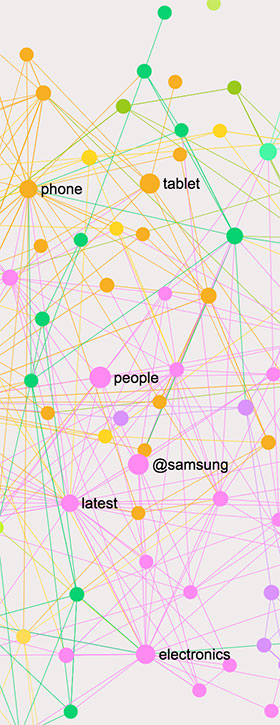
They will be visualized as a graph using our state-of-the-art text network analysis software. Every word is a node, every co-occurrence of words is a connection between them. This visualization allows you to see the most relevant clusters of keywords in context.
We then apply powerful network science metrics to identify the most relevant keyword combinations, so that you know both what people search for and what they actually find.
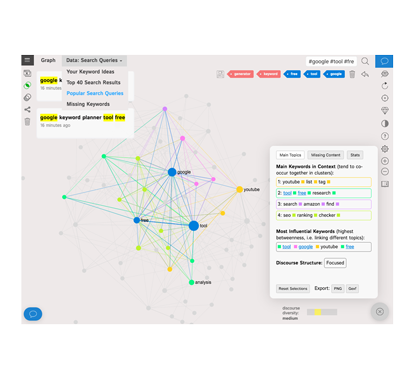
2. Visualize SERP and Related Keywords as Network Graphs
You can switch between the search engine results page (SERP) graph and the graph of the keywords people use with your query, so you can compare what people search for (keywords) to what they actually find (SERP).
This helps you better understand both the content that already exists on the market as well as the content that people are actually looking for.
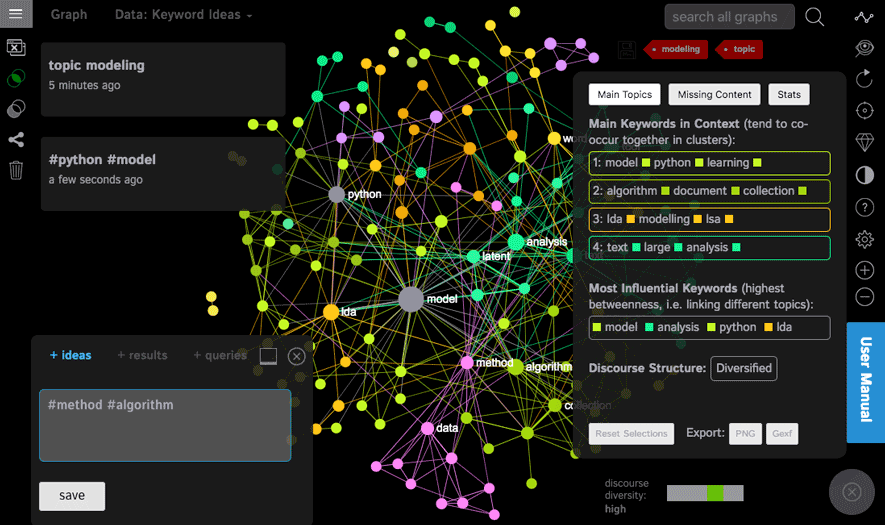
We also provide the powerful analytics toolbox which can identify the main topics (niches) and estimate how dense or diverse your target market may be.
You can also click any word in the graph to see the context where it appears.
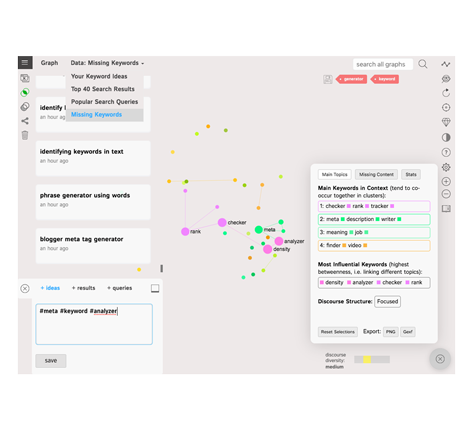
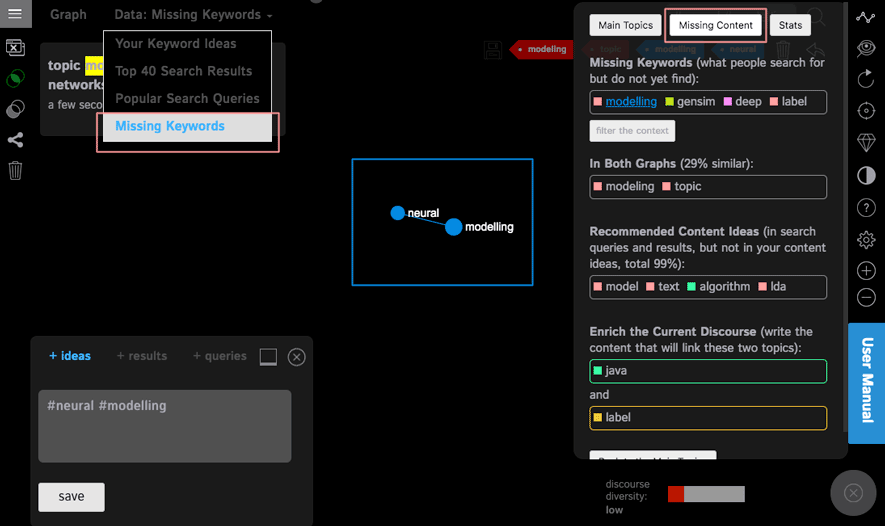
3. Find the Missing Keywords
The most interesting feature is the "missing keywords" functionality.
It compares the two graphs in order to find the difference between what people search (related keywords) for and what they find (SERP).
If you then create the ads or the content that will target these niches, you are almost guaranteed to get to the top of the Google search results.
Simply click the "Missing Keywords" functionality and then save the keywords you select on the graph.
Visual Keyword Generation Step by Step:
First, add the keyword query that you are interested to explore. It can be your research topic or a general keyword phrase you want to explore the context for. For example, "topic modeling".
You will see two graphs superimposed: one that contains the search results (the supply), the other one that contains the related search queries (the demand). Using the Analytics panel you can see what are the main topics related to that search query.
You can select the most relevant keywords and topics on the graph and save them into your keywords list.
You can add more related search keywords using the "+queries" field or more search results for a specific query using the "+results" field.
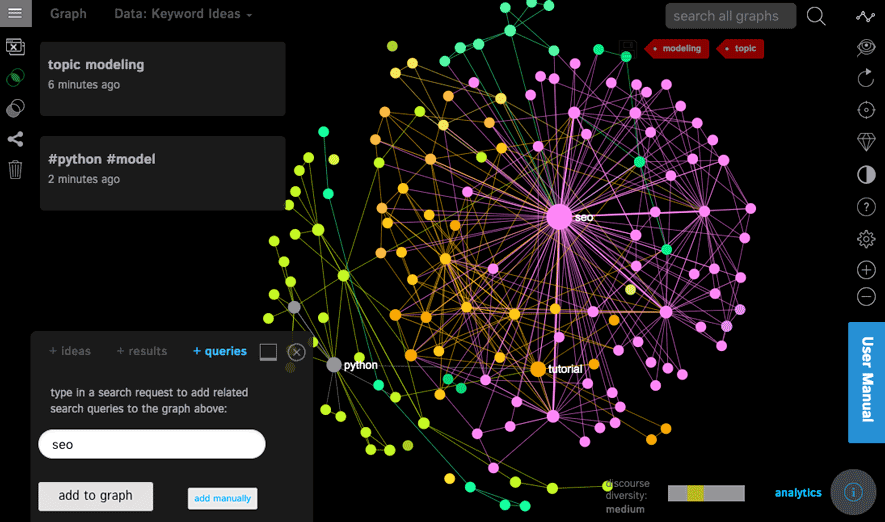
The most interesting feature is the Missing Keywords: select this option to see what people search for (demand) but do not find (supply). In this case we see that using neural networks for topic modeling is demanded by users but is not represented in search results. So that could be a good niche to explore.
Try Keyword Graph Now
Don't wait, sign up to try out this tool and start getting the results.
Pricing Options
You can use the Keyword Graph on the cloud or install it on your own computer or server.
Starter
Dedicated Support
- Instant Activation
- Hosted on the Cloud
- Dedicated Support
- up to 25 Saved Graphs
Agency
Dedicated 24/7 Support
- Instant Activation
- Hosted on the Cloud
- Dedicated 24x7 Support
- up to 100 Saved Graphs
Enterprise
Enterprise SLA
- Dedicated Database
- Your Servers or Cloud
- Setup & Customization
- Unlimited Graphs
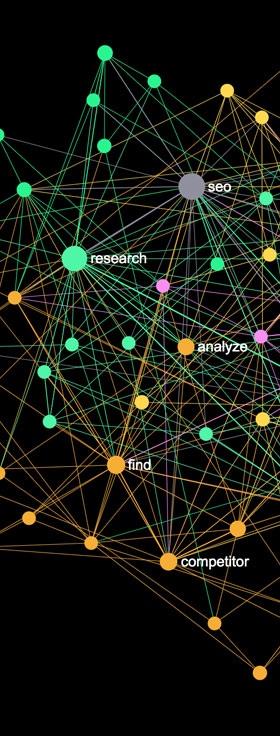
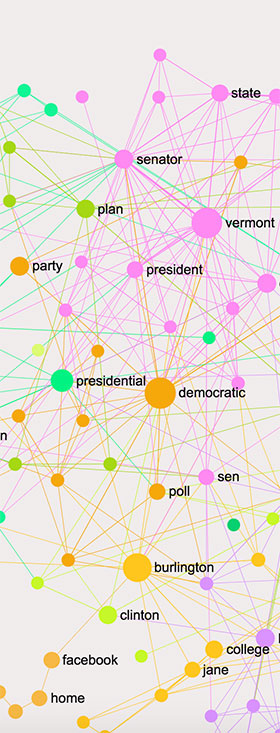
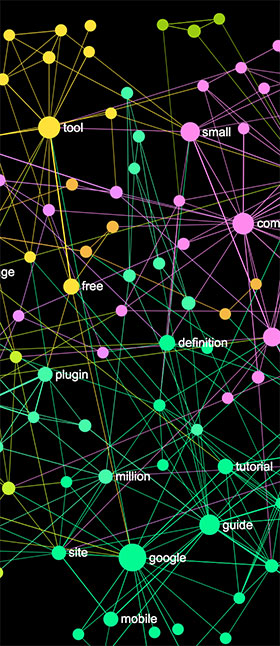
SEO Graphs: Interactive Examples
Below you can find the examples of SEO keyword graphs for different search queries. Open the graphs, play around with the interface, and click the "Missing Keywords" button to identify the difference between the demand and supply.
Technical Support
KeywordGraph is developed by Nodus Labs, the creator of InfraNodus. All the features of the Keyword Graph are very easy to use and we also have a step-by-step tutorial available in the app. However, should you have any questions, please, feel free to browse the case studies on our Nodus Labs support portal or to contact us directly. We will show you how you can make the most out of this tool for your particular use case.